Compliance Testing - Fairness Assessment using R
- Compliance Testing - Fairness Assessment using R
- Preprocessing - Semantic tagging using the LSEG-PermID (Open Calais) service
- Step1 - Load data and libraries
- Step 2 – Perform Principal Component Analysis (PCA) and evaluate clustering potential
- Step 3 - Perform K-means on a factor scores sub-space at evaluate performance with a minimum number of clusters
- Step 4 - Display retained clusters statistics
- Step5 - Evaluate fairness of Basing Hall-BIC selection process
In order to perform PCA we remove the low weight Categories: A1(column 2),A2(column 3),A14(column 15) as well the company ID in column 1 and the last columns (Status, RetDis and OldNew) This is done in the column selector parameter of the prcomp() function, here: c(4:14,15:17)
PCA prcomp() function parameters:
- c(4:14,15:17) -> column selection :
- “center” each column around its average
- normalise each column “scale” by dividing by the column variance (Variance in normalized to 1)
see: Principal Component Analysis in R: prcomp vs princomp (http://www.sthda.com/english/articles/31-principal-component-methods-in-r-practical-guide/118-principal-component-analysis-in-r-prcomp-vs-princomp/)
occ.pca <- prcomp(OCC_wStatus[,c(4:14,15:17)], center = TRUE, scale = TRUE)
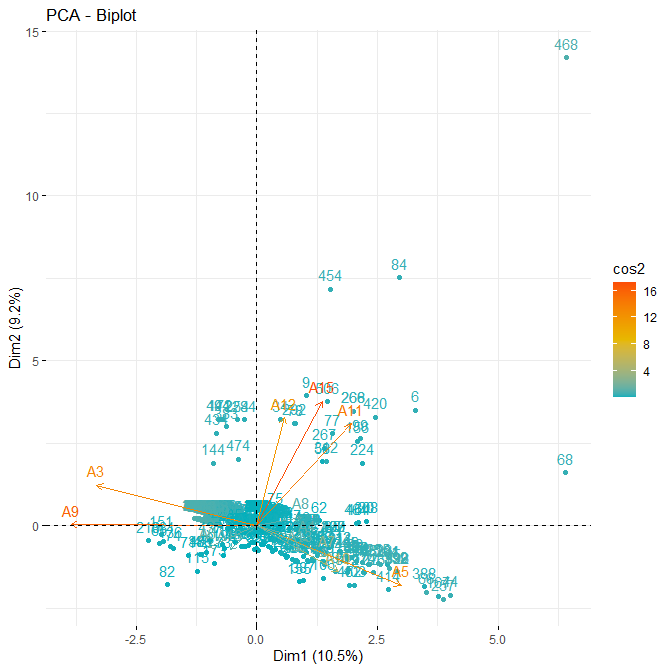
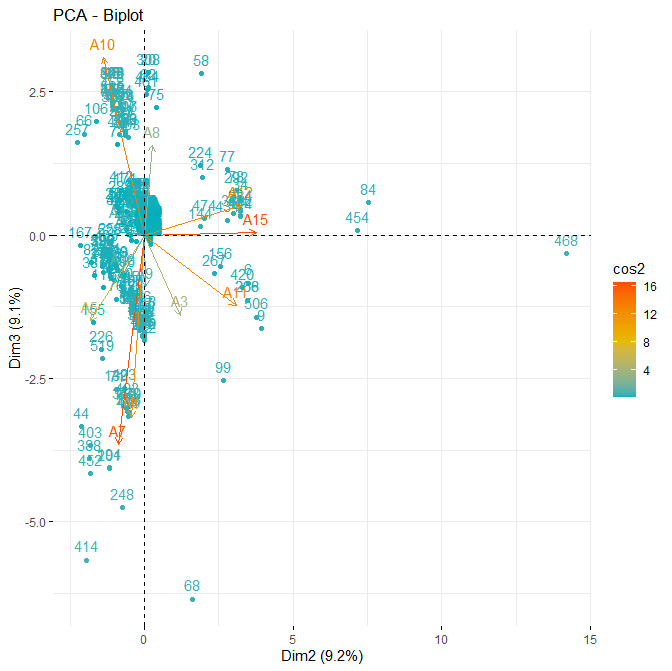
fviz_pca_biplot(occ.pca, axes = c(1, 2),
col.ind = “cos2”, # Color by the quality of representation
col.var = “contrib”, # Color by contributions to the PC
gradient.cols = c(“#00AFBB”, “#E7B800”, “#FC4E07”),
)
Modify point colors with ggplot2 using the “palette” parameter
in: ggplot2 – Essentials (http://www.sthda.com/english/wiki/ggplot2-essentials)
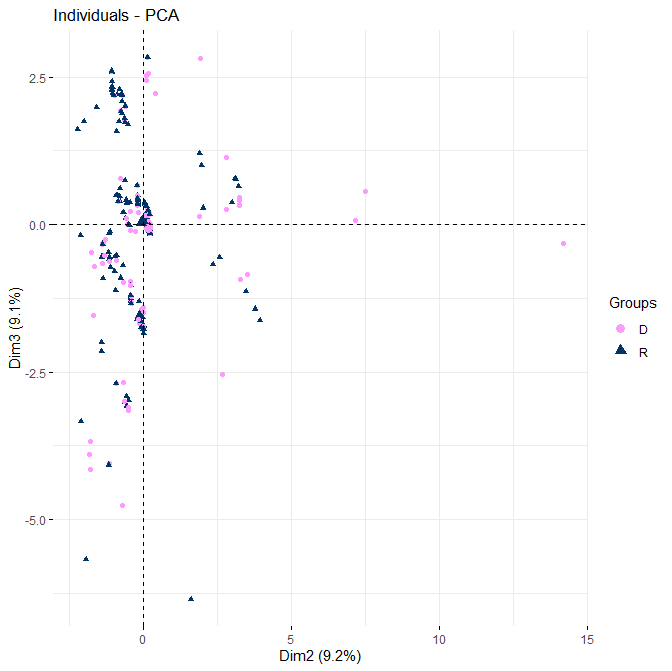
fviz_pca_ind(occ.pca, label = “none”, # hide individual labels
axes = c(2,3),
habillage = OCC_wStatus$RetDis, # color by groups
palette = c(“#FF99FF”, “#003366”)
)