
Compliance Testing - Fairness Assessment using R
- Compliance Testing - Fairness Assessment using R
- Preprocessing - Semantic tagging using the LSEG-PermID (Open Calais) service
- Step1 - Load data and libraries
- Step 2 – Perform Principal Component Analysis (PCA) and evaluate clustering potential
- Step 3 - Perform K-means on a factor scores sub-space at evaluate performance with a minimum number of clusters
- Step 4 - Display retained clusters statistics
- Step5 - Evaluate fairness of Basing Hall-BIC selection process
Determine the k=5 clusters PCA factor space 2-3
Note: We are reusing the df table which was built before from the extracted PCA 2-3 factor scoresfactor
Pre-determine the pseudo-random series used to determine the initial k-means centers
Note: This determination is done so that clusters will be stable between R runs
set.seed(123)
Compute k-means with k = 5
km.res <- kmeans(df, 5, nstart = 25)
Display results as “coverage” polygons
Plotting the cluster results in axes 1,2 plane (Here, the entire data space is 2 dimensional)
NOTE:
- Here we have “axes = c(1,2)” because by construction we have only 2 components (i.d., factor scores)
- The “palette” parameters for 9 potential clusters are preset following : Colors in R (http://www.sthda.com/english/wiki/colors-in-r)
fviz_cluster(km.res, data = df,
palette = c(“#00AFBB”,”#2E9FDF”, “#E7B800”, “#FC4E07”, “#3399FF”, “#FF3399”, “#336600”, “#330033”, “#009966”),
axes = c(1,2),
ggtheme = theme_minimal(),
main = “Partitioning Clustering Plot”
) + scale_x_reverse()
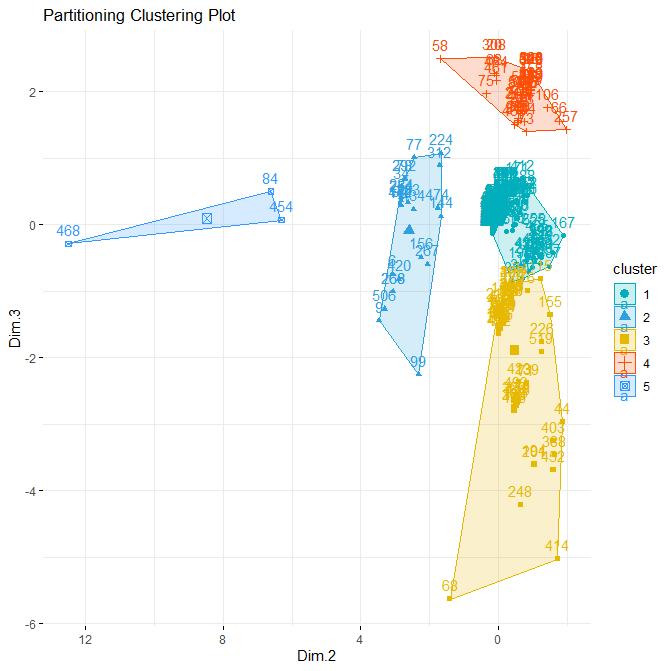
INTERPRETATION -> The separability of the 5 determined groups is rather good
PROBLEM TO BE SOLVED : The k-means has labeled the members as belonging to one of 5 different groups (or classes). However, their coordinates have been modified. We need to place each of these labeled members into their original data space
Here, we seek to place the points back into the original 2-3 PCA factor space.
This placement will enable to interpret the relations between each cluster and the “tag” variables determined by Open Calais
Here we follow the R practice of Alboukadel Kassambara who is one of the main contributors to the factoextra R package (http://www.alboukadel.com/)
grp <- as.factor(km.res$cluster)
fviz_pca_biplot(occ.pca, axes = c(2, 3),
habillage = grp,
addEllipses = TRUE)
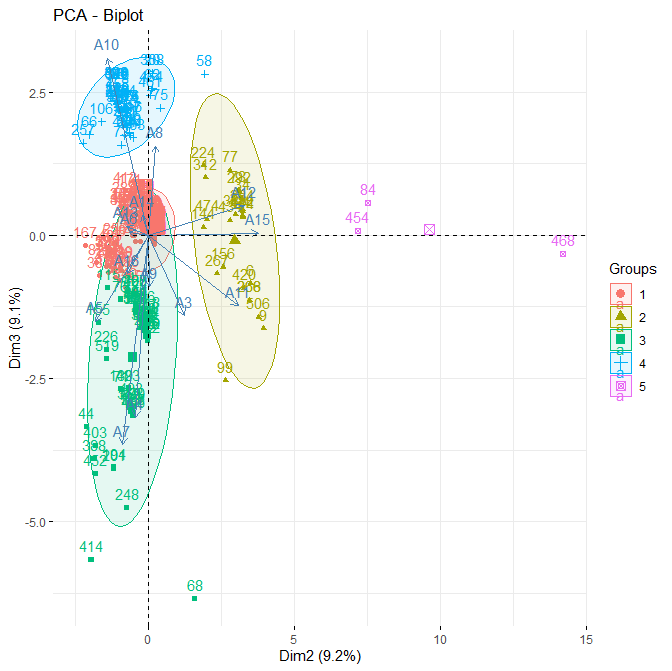
INTERPRETATION -> The separability of the 5 determined groups is again well characterized
NOTE : for the interpretation of each “tag” variable (A1 to A16), see : ( https://github.com/MoiraCorp/Compliance-Testing-Fairness-Assessment-using-R/tree/main/permid-preprocess )
It is common practice to characterize each of these groups by their most “influential” variables represented in the PCA 2-3 plane by their vectors (A1, A2 …).
For example, the Group 2 (in yellow in preceeding illustation) of companies is characterized by their higher values (i.d., correlation) for variables (i.d., category scores) A11, A12 and A15. Namely:
A11: “Human_Interest”
A12: “Hospitality_Recreation”
A15: “Sports”